Last month, we began this miniseries on pump selection with a look at the simplest of pump curves - those showing only pressure and flow, as are typically seen for residential submersible pumps. When the capacity and horsepower requirements of a pumping system go up, pump specifiers may need additional information such as pump efficiency, horsepower and NPSH (net positive suction head) at different flow rates. This month, we will begin to look at these additional factors.
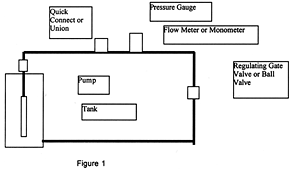
But first, let's see how pump curves are created. The pump curves we see in pump manufacturers' catalogs are a visual representation of test data collected in their labs. To collect this data, a technician connects the pump to a test station containin g a pressure gauge (or a manometer), a valve to regulate the flow and a flow meter to measure the flow rate. See Figure 1.
A manometer is a clear tube mounted vertically that contains a liquid such as water or mercury. It can measure either positive pr essure or vacuum. The pressure or vacuum developed by the pump forces the liquid up the tube against the force of gravity, and the reading is reported in terms of inches of mercury or feet of water head. Remember that psi is directly proportional to inches of mercury and feet of head, and the three terms can be used interchangeably. one psi equals 2.31 feet of head, and 1 foot of head is 1.13 inches of mercury.
To plot a pump's curve, the technician starts with a piece of graph paper. The horizontal axis represents the flow rate, and the vertical axis shows pressure. In the United States, flow is measured in gallons per minute (gpm), and pressure is measured in pounds per square inch (psi), or feet of water. The first point on the curve is generated by closing the regulating valve all the way to dead head the pump and measuring the pressure on the gauge. Next, the valve is slowly opened until, say, 5 gpm shows o n the flow meter, and the resulting pressure is recorded on the graph paper. This procedure is repeated until the regulating valve is wide open and the pump is at what is called open discharge. The resulting curve is the simplest form of a pump curve, and it can be used to select a pump.
With a good pressure gauge and a flow meter, you can test the performance of a pump in your own shop and create a curve. This might come in handy some time if you find yourself in a performance dispute with a customer or pump manufacturer and wish to verify the pump's performance for yourself. For more information on how to build a pump test station, check out the April 2001 issue of National Driller.
As mentioned earlier, there are three other factors that could be considered when selecting a pump - efficiency, horsepower and NPSH. These factors are represented graphically as the efficiency curve, the horsepower curve and the NPSH curve (See Figure 2 at the bottom of this page). The NPSH curve will be discussed in detail in t his column in the near future.
The efficiency curve shows the relative cost to run the pump. It is generated by measuring the amount of energy consumed by a pump at various flow rate points, relating that to the amount of work done (gpm and head) at e ach point and calculating an efficiency number. Pump efficiency always is important, but it is important particularly when you are pumping a lot of water. If you have several pumps from which to choose for a particular job, the more expensive pump might p ay for itself in a short period of time through energy savings if it is more efficient.
Horsepower curves are essential in selecting the proper pump motor, and they can be used in the same way as the efficiency curves to determine the relative operatin g cost of a particular pump. For example, when we take electric motor efficiency into account, 1 Hp equals approximately 3/4 kW (750 watts). To estimate the annual operating cost of a pump, find the horsepower at the operating point, and multiply by the number of hours per year you expect the pump to run. This times .75 gives the number of kilowatt-hours of electricity consumed by the pump in a year. Multiply this number by the cost of a kilowatt, and you have an estimate of the annual cost of the energy to run the pump. Referring to Figure 2, at 70 gpm, the motor is drawing 3 Hp. If we expect to run the pump 5,000 hours per year, this pump would use 11,250 kW hours per year (3 Hp x 5,000 hours x .75 = 11,250 kW). At $.20 cents per kW hour, the annual ope rating cost for this pump is $2,250 for electricity.
Now, if you could find another more efficient pump that only used 2.5 Hp to pump the required amount of water, the annual cost of electricity will be 2.5 x 5000 x .75 x .2 = $1,875 per year, a savin gs of $375 over the first pump. Factor in the cost difference of the two pumps, and you might find the more efficient, more expensive pump would cost less over the life of the pump.
Next month we will continue this miniseries on pump curves with a look at composite curves and pump charts.
Click here for Figure 2.
NOTE: You will need Adobe Acrobat Reader to view this PDF. Click here for this free download.

Report Abusive Comment