Using geographic information systems technology, the model incorporates information on nitrogen, including:
- commercial inorganic fertilizers used on farms, in residential areas, and for other non-agricultural uses
- extent of cropland (a general indicator of increased crop intensity and manure applications)
- population density (increased population density generally is associated with non-agricultural sources of nitrogen, such as septic systems, sewers, industrial emissions (atmospheric) and domestic animal wastes).
The model also incorporates information on factors affecting aquifer susceptibility, including:
- extent of well-drained soils (in general, coarse-grained soils, such as sands, allow water and nitrate to seep to the water table more readily than poorly drained soils, such as fine-grained clays)
- presence of sand and gravel aquifers (loose, coarse-textured rocks are porous and readily transmit water and nitrate through the aquifer system)
- depth to ground water (increased depths generally are associated with well-oxygenated soils, which have little potential for natural removal of nitrate through denitrification).
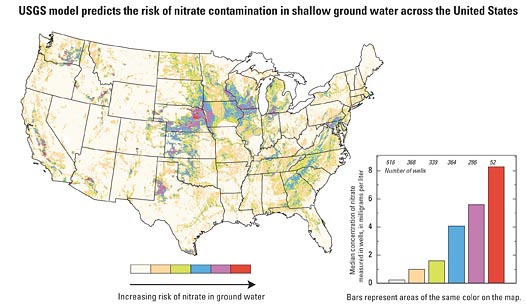
Model findings predict the likelihood of nitrate occurring at or above 4 milligrams per liter. This threshold was selected because it indicates inputs of nitrate from human activities rather than concentrations that may occur naturally in soils or aquifers. In addition, 4 milligrams per liter has been associated with an increased risk of non-Hodgkin's lymphoma.
Areas with the highest risk for nitrate contamination of shallow ground water (shown in red) generally have high inputs of nitrogen to the land, well-drained soils and coarse-textured aquifers. As shown on the bar graph, data on measured nitrate concentrations strongly support the results of the national model, and indicate that the median concentration of nitrate in the areas of lowest contamination risk (shown in light beige) is 0.24 milligrams per liter, and, in areas of highest risk (shown in red), it is more than 8 milligrams per liter. Note that it is not advisable to use the map to identify and prioritize areas of contamination at a smaller scale than is depicted here because local variations in land use, hydrogeologic conditions and other factors can result in nitrate concentrations that do not conform to risk patterns shown here at a national scale. For example, sinkholes in karst areas can facilitate relatively rapid leaching of nitrate to ground water, but karst features could not be mapped at a national scale.
ND
Report Abusive Comment