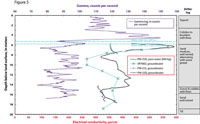
Figure 5. Vertical profile of groundwater electrical conductivity from ESASS profile VP7002, conductivity along the screen intervals of installed wells, driller log, equivalent pore-water conductivity from a borehole EM conductivity log, and natural gamma log of well PW-25D, Savage Superfund site, Milford, N.H. (Equivalent pore-water conductivity calculated from EM log using relations described by Archie [1942].)
Editor’s note: This feature looks at the results of the ESASS study featured in Part 1 of this article in the December 2012 issue of National Driller.
Last month’s article took a look at the U.S. Geological Survey’s Enhanced Screen Auger Sampling System, and its use at two sites. The sites were of two broad categories: a waste site with anthropogenic contamination from waste disposal, and reference sites with no known waste-disposal history. This article continues the discussion, and examines the results of the study.
Waste Site
An Enhanced Screen Auger Sampling System (ESASS) profile, labeled VP7002, was drilled to a refusal depth of 67 feet below land surface inside the barrier. Vertical profiling was done at approximately a 6.5-foot vertical sampling interval and results are presented for water electrical conductivity (Figure 5) and PCE (Figure 6).
A 2-inch inner diameter PVC casing well, labeled PW-25D, was installed and screened from 47.5 to 57.4 feet below land surface within the same ESASS profile hole (VP7002). Borehole natural gamma and EM conductivity logs were run in the installed PW-25D well.
The ESASS profile of water electrical conductivity mea-sured large vertical changes from 570 to 260 µS/cm in the shallow groundwater (from 18 to 39.4 feet in depth) near the water table (Figure 5). This large variation in conductivity is not discernible in the shallow well (PW-25S), which was installed and screened from 18 to 27.9 feet below land sur-face at that same location after ESASS profiling. The water electrical conductivity profile, which was measured with a downhole conductivity probe along the screen interval of well PW-25S, showed a trend unlike that of the ESASS pro-file, although values at 26.25 feet in depth matched.
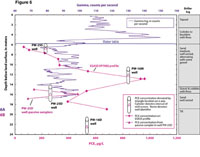
Figure 6. Vertical profile of PCE from ESASS profile VP7002, PCE measured in adjacent wells and natural gamma log and driller log of well PW-25D, Savage Superfund site, Milford, N.H.
Trends in pore-water conductivity derived from the EM conductivity log of well PW-25D and relations described by Archie (1942) compare favorably to the ESASS verti-cal profile of electrical conductivity from water samples (Figure 5). The maximum conductivity from the pore water of the EM log occurred near the water table similar to the ESASS profile. The minimum conductivity from the pore water of the EM log occurred at 26.25 feet, about 3.25 feet shallower than the depth at which the minimum water conductiv-ity was measured with the ESASS profile. Differences in depths associated with minimum values may be partly related to temporal variations in the water table and varia-tions in vertical resolution of measurements. The ESASS profiler vertical resolution is shorter (1 foot in length) and more discrete than the vertical resolution of the EM probe (about 3.25 feet in length).
Large changes (0.5 order of magnitude difference) in PCE concentrations were measured in the shallow ground-water at ESASS profile VP7002 (Figure 6). PCE concentra-tions increased from 64 µg/L, at 21 feet in depth, to 320 µg/L, at 29.25 feet in depth. The PCE concentration from well PW-25S favorably matched (relative percent difference of 0 percent) the PCE concentration from the ESASS profile at 26.25 feet in depth. Above that depth, the PCE concentration from the ESASS profile was less than that of PW-25S (Figure 6).
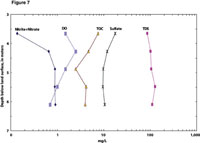
Figure 7. ESASS vertical profile of concentrations of nitrite-nitrate, dissolved oxygen (D.O.), total organic carbon (TOC), sulfate and total dissolved solids (TDS), reference site, East Bridgewater, Mass.
The low-flow sample from well PW-25D had a lower PCE concentration (260 µg/L) than did samples from com-parable intervals measured with the ESASS profile (530 and 390 µg/L). However, deployment of a vertical string of precision depth recorder samplers along the well screen in well PW-25D and subsequent analysis of their PCE concentrations identified vertical variations that may explain these differing PCE concentrations between the ESASS and well samples. The PDB samplers deployed at 49.25 and 55.8 feet in depth measured relatively low PCE concentrations (<200 µg/L). However, the PDB sampler deployed at the 52.5-foot depth had a PCE concentration of 466 µg/L, lower than the concentration of 530 µg/L in the ESASS profile sample (relative percent difference of 12.8 percent) from the 49.25-foot depth but higher than the 390 µg/L concentration in the ESASS profile from the 55.8-foot depth. Thus, we surmise that the PCE concentration sampled in well PW-25D that was measured from low flow is a mixture of water along the well screen.
At VP7002, the ESASS profile was able to identify chemical processes based on vertical trends in electrical conductivity and PCE. For example, the large variation in electrical conductivity in shallow groundwater near the water table could be the result of preferential transport of a chemical oxidant (permanganate) introduced during ISCO treatment of OU1 from 2003 through 2008. Low PCE concentrations in the shallow groundwater could be the result of that same oxidant reacting with the PCE and converting some of it to a chloride by-product. High PCE concentrations at several depths corresponded to strati-graphic contacts between hydrogeologic units of contrasting permeability. The highest PCE concentration at VP7002 occurred at a depth of 42.7 feet below land surface, which was mapped to be within a well-sorted, permeable sand layer that is 4.25 feet above a contact with a poorly sorted, less permeable cobble layer (Figure 6).
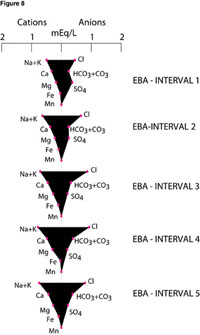
Figure 8. Stiff groundwater quality diagrams from ESASS vertical profiling, reference site, East Bridgewater, Mass. [Samples designated as East Bridgewater (EBA) intervals 1-5.]
Five ESASS profile samples at vertically spaced inter-vals of 2 feet were collected from the upper 20 feet of groundwater at the East Bridgewater (EBA), Mass., site. The sediments consisted of fairly uniform coarse to medium sands. The depth to water table was less than 9.8 feet. Two ESASS profile samples at vertically spaced intervals of 4.9 feet were collected from the groundwater at the Duxbury (D4A), Mass., site, which was located on a high sand terrace. The sediments consisted of nonuniform, gradational fine to very fine sands overlying a marine clay layer. The depth to water table exceeded 32.8 feet below land surface and ESASS was able to sample with the bladder pump despite the thick unsaturated zone. Two ESASS profile samples were collected in the gradational sands. A third sample was attempted in the marine clay but purging caused dewatering of the screen auger.
After ESASS profiling, 2-inch inner diameter PVC wells were installed at both sites, at depths near those of the profile samples. At the EBA site, a well screen was set at 16 to 18 feet below land surface, between vertical intervals 3 and 4. At the Duxbury (D4A) site, a well screen was set at 46.9 to 48.9 feet below land surface, between ESASS vertical intervals 1 and 2. No water samples were collected from the installed wells immediately after ESASS profiling until 2010 when routine sampling was performed by the USGS National Water-Quality Assessment Program study.
At the EBA site, most chemical constituents and some cations and anions (except sulfate) increased or changed negligibly in concentration with depth (Figure 7). Nitrate was the dominant nutrient at both sites. Concentrations of combined nitrite and nitrate values increased with depth: from 0.138 mg/L at EBA interval 1 to 0.915 mg/L at EBA interval 5 (Figure 7). Nitrate concentrations (as nitrite and nitrate) at the shal-lowest depth were particularly low (0.138 mg/L), suggesting nitrate uptake by plants. In contrast, sulfate concentrations decreased with depth, from 17.6 mg/L at EBA interval 1 to 9.55 mg/L at EBA interval 4.
Stiff diagrams (Figure 8) show the predominant distribution of anions and cations including iron (Fe) and manganese (Mn) in groundwater at each sampling depth from the East Bridgewater site. Changes in concentration and resultant changes of shape of stiff diagrams are greatest between shallow sampling intervals 1 and 3. Specifically, the increase in chloride concentration with depth relative to other anions suggests that recently recharged groundwater contains the lowest amounts of chloride.
Age dating from CFC samples collected from the uppermost (12.1-foot) and lowermost (20-foot) depths at the East Bridgewater site calculated an apparent age of 14.6 to 21.8 years old, respectively. Given that the vertical dis-tance between samples is 8 feet, the age gradient is approximately 3 years per vertical yard.

Figure
9. Stiff groundwater quality diagrams from ESASS vertical profiling, reference
site, Duxbury, Mass. (samples designated as Duxbury [D4A] intervals 1 and 2).
Only a qualitative comparison can be made between the water-quality results from the ESASS profiles at the reference sites and the results from the installed observation wells that were sampled as part of the NAWQA routine sampling pro-gram in 2010. Temporal differences in groundwater chemis-try are to be expected between the time of the ESASS profile in September 2008, and the routine NAWQA sampling of the wells in June 2010. Given this framework, perhaps the most relevant comparison of selected constituents is the compara-bility of anthropogenic contaminants, namely, detection of VOCs at the two reference sites. At the East Bridgewater site, negligible VOCs were detected in the results from the ESASS profile or the observation well. Several other constituents also compared favorably, such as dis-solved oxygen and dissolved solids. In contrast, iron and manganese concentrations were much greater (higher) in the ESASS profile samples than the well sample.
Compared to the East Bridgewater site, the Duxbury site chemistry showed additional influences by anthropogenic activities. The groundwater chemistry at the Duxbury site showed relatively high sodium and chloride, likely from road salting (Figure 9). The ESASS profile samples of the Duxbury site also had detectable concentrations of the gaso-line-derived contaminants methyl tertiary butyl ether (MTBE), toluene and benzene. Similarly, MTBE was detected in the observation well sample from 2010, supporting ESASS results.
The chemical results from the ESASS profiles identi-fied large changes (up to an order of magnitude change in concentration) in major ions and nutrients with depth over a vertical distance of 8 feet, indicating vertically hetero-geneous chemical conditions and the ability of the ESASS to collect depth-specific discrete samples. The ESASS tool proved useful in identifying several potential biogeochemical processes that could be studied in subsequent investigations.
Conclusions
For the locations (waste site and reference sites) and applications tested, ESASS proved to be a useful tool in vertical profiling of groundwater quality to depths of 82 feet below land surface during drilling with hollow-stem augers and a screen auger. ESASS was able to profile in a variety of unconsolidated sediments and through resistant “hard” lay-ers of cobbles and boulders that are difficult to penetrate using some direct-push sampling systems. Use of ESASS allowed installation of observation wells of conventional size (2-inch inner diameter) through the U.S. patent tool (U.S. patent no. 7,631,705 B1). ESASS profiling identified large vertical variations in concentrations (approximately an order of magnitude difference in concentration) in constitu-ents over a 8 feet vertical distance. Results suggest that ESASS is effectively sampling depth-specific groundwater samples representative of the length of the auger screen interval (1 foot in length screen).
At the waste site, the Savage Superfund Site in Milford, N.H., an ESASS profile in October 2007 showed large vertical variation in water electrical conductivity and in PCE concentration (0.5 order of magnitude difference) immediately below the water table. These results were not discernible using conventional well sampling (low flow) from an adjacent shallow well with a 9.8 foot in length screen. Differences are attributable to the capability of ESASS to profile over vertical spacing lengths of 2 feet (interval tested) and to distinguish vertical variations in groundwater quality. In this case, the large variation in electrical conduc-tivity of the shallow groundwater near the water table could result from preferential transport of a chemical oxidant (permanganate) introduced during remediation. Low PCE concentrations coincident with high electrical conductivity suggest reaction of the oxidant with the PCE, thereby con-verting some of the PCE to a chloride by-product. At deeper depths, high PCE concentrations (exceeding 500 µg/L) cor-responded with stratigraphic contacts.
At intervals where ESASS showed small vertical varia-tions in PCE concentrations (less than a factor of 2), ESASS vertical profile results generally matched (relative percent difference <25 percent) results from conventional sampling in adjacent wells. At other intervals where ESASS results showed large vertical variations in PCE concentrations, ESASS vertical profile results compared poorly to results from adjacent wells because of differences in well screen lengths, likely circulation patterns in the well screen and capture zones of sampled well water. Further testing of ESASS would be needed to determine its general utility and the reproducibility of its results, including comparison with results from other profiling methods.
At the two reference (no known waste-disposal history) sites, at East Bridgewater and Duxbury, Mass., ESASS successfully profiled and collected groundwater samples through sand and gravel deposits to depths of 49.25 feet below land surface. At the East Bridgewater site, large changes in groundwater chemistry (differences of approxi-mately an order of magnitude in concentrations of selected constituents) with depth were identified in August 2008 in the shallow (upper 9.8 feet) groundwater just below the water table.
At both types of sites tested (waste and reference), ESASS profiling identified large variations in shallow groundwater quality. The implications for sampling shal-low groundwater quality from our ESASS application are substantial in that the vertical placement of well screens even over short distances can have important ramifica-tions for the chemical quality of the groundwater sampled. An apparent age gradient of 3 years per vertical meter of groundwater was computed at the reference site in East Bridgewater. Tools such as ESASS, which can be used to vertically profile and identify vertical variations in ground-water quality, and to install observation wells with improved screen placement, can demonstrate the importance of understanding vertical chemical differences in groundwater while potentially eliminating the need for mobilization of additional vertical profile rigs and devices. ND
This article was reprinted with permission from the Winter 2011 issue of Ground Water Monitoring & Remediation, a publication of the National Ground Water Association.
References
Archie, G.E. 1942. The electrical resistivity log as an aid in deter-mining some reservoir characteristics. Petroleum Transactions of AIME 146: 54-62.Busenberg, E., and L.N. Plummer. 1991. Chlorofluorocarbons (CCl3F and CCl2F2)-Use as an age dating tool and hydro-logic tracer in shallow ground water systems. In Proceedings, U.S. Geological Survey Toxic Substances Hydrology Program, Technical Meeting. Monterey, Calif., March 11-15, 1991, ed. G.L. Mallard and D.A. Aronson. U.S. Geological Survey Water-Resources Investigations Report 91-4034,
542-547.
Clifford, S. 2008. Written communication to author. U.S. Environmental Protection Agency, Region 1.
Flanagan, S.M., D.L. Montgomery and J.D. Ayotte. 2000. Shallow ground-water quality in the Boston, Mass., metropolitan area. U.S. Geological Survey Water-Resources Investigations Report 01-4042, 12. http://pubs.water.usgs.gov/wrir01-4042 (accessed April 2009).
Harte, P.T. 2008. Differential rates of PCE declines in a sand and gravel aquifer, in National Ground water Association 2008 Ground Water Summit, Memphis, Tenn.
Harte, P.T., M.J. Brayton and W. Ives. 2000. Use of passive dif-fusion samplers for monitoring volatile organic compounds in ground water. U.S. Geological Survey Fact Sheet 088-01, 4.
Johnson, U.O.P. 1966. Groundwater and Wells, 1st ed. St. Paul, Minn.: Edward F. Johnson Inc.
Keys, S.W. 1990. Borehole, geophysics applied to ground-water investigations. U.S. Geological Survey, Techniques of Water-Resources Investigations, Book 2, Chap. E2, 150.
Pitkin, S.E., J.A. Cherry, R.A. Ingleton and M. Broholm. 1999. Field demonstrations using the Waterloo Groundwater Profiler. Ground Water Monitoring and Remediation 19: 122-131.
Plummer, L.N., and E. Busenberg. 1999. Chlorofluorocarbons: Tools for dating and tracing young groundwater. In Environmental Tracers in Subsurface Hydrology, Chapter 15, ed. P. Cook and A. Herczeg, 441-478. Boston, Mass.: Kluwer Academic Publishers.
Rose, D.L., and M.P. Schroeder. 1995. Methods of analysis by the U.S. Geological Survey National Water Quality Laboratory-Determination of volatile organic compounds in water by purge and trap capillary gas chromatography/mass spectrometry. U.S. Geological Survey Open-File Report 94-708, 26.
Shuter, E., and W.E. Teasdale. 1989. Application of drilling, cor-ing and sampling to test holes and wells. Techniques of Water Resources Investigations of the U.S. Geological Survey, Book 2,
Chap. F1, 97.
Taylor, T.W., and M.S. Serafini. 1988. Screened auger sampling: The technique and two case studies. Ground Water Monitoring and Remediation 10, no. 4: 145–152.
Thomas, D. 2010. Written communication to author. Central Mine Equipment Company. November 22, 2010.
Williams, J.H., W.W. Lapham, and T.H. Barringer. 1993. Application of electromagnetic logging to contamination inves-tigations in glacial sand-and-gravel aquifers. Ground Water Monitoring and Remediation Review 13, no. 3: 129–138.
ESASS Procedures
Several procedures involved with the use of ESASS (Enhanced Screen Auger Sampling System) as a vertical profiling tool are discussed in this section.Decontamination Procedures with ESASS
The ESASS tool, the bladder pump and all associ-ated augers (the screen auger and the auger that houses the ESASS) are decontaminated before sampling at a new pro-file location. A 0.1 percent solution of phosphorous-free detergent and D.I. water, followed by rinse of D.I. water, and lastly a methanol rinse (required if sampling for VOCs) are next applied externally. Finally, the tubing and internal pump mechanisms of the bladder are run through a D.I. water rinse during a trial run of the bladder before profiling at a new location.
During profiling, in between successive sampling events before advancing the auger, the extraction/injection tube and bladder pump are flushed with D.I. water. Flushing occurs by injecting through the extraction/injection tube while simultaneously extracting with the downhole bladder pump, thereby creating a circular cleaning motion to flush out the auger screen and to clean out the bladder pump and tube. As the bladder pump purges during this process, water electrical conductivity is monitored to ensure decontamina-tion and flushing. Monitoring has shown that the electrical conductivity of the purged water during this decontamina-tion process decreases by 50 percent or more when D.I. water from injection is captured by purging with the bladder pump. The amount of D.I. water injected is a function of the storage held in the extraction/injection tube, the extraction tube, the bladder chamber and approximately one-eighth the volume of the screen auger. Consequently, the amount of water extracted with the bladder pump is constrained by the amount of D.I. water injected to ensure minimal extrac-tion of additional ambient water during the decontamination process.
Quality Control and Assurance
Equipment blanks are collected from rinse water from the auger screen and from the auger in which the ESASS is housed. The rinse water, which consists of standard D.I. water, is retained for analysis pending the results of the analysis of the equipment blank sample. The rinse water from the auger screen is then purged through the bladder pump and tube to simulate sampling. The purged water is collected and submitted for laboratory analysis. Duplicates of samples are collected according to project protocol. Trip blanks are submitted for laboratory analysis of VOCs if VOCs are being sampled. Trip blanks consist of labora-tory-grade water and it is held in storage with samples in transit.


Report Abusive Comment