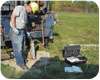
Field sampling with ESASS during hollow-stem auger drilling with a screen auger.
When it comes to vertical profiling of the subsurface, auger-screen sampling methods (Taylor and Serafini 1988) offer two advantages in selected applications over some traditional direct-push methods (Pitkin et al. 1999): conventional inner diameter 2-inch observation wells can be installed after vertical profiling, and coarse-grained, uncon-solidated deposits, such as cobble and boulder layers, can be penetrated.
However, auger-screen sampling requires the evacuation of large volumes of water in order to:
• clear the screen auger and the auger flights of stagnant water
• reduce turbidity of the water
• obtain a representa-tive sample of water from the area adjacent to the auger screen.
Evacuating such large volumes of water also pres-ents disposal problems at contaminated sites, resulting in greater costs. The inside diameter of the augers is 3.25 inches and the augers contain 4.8 quarts of water per meter of auger length. Therefore, water storage and purge requirements increase with depth drilled and as auger flights are added. Reducing purge volumes and isolating the water in the auger screen-typically the lead auger-from the auger column above, it is possible by using a portable packer and pump system within hollow-stem auger flights. However, the logistics of lowering, purging, sampling, and then retrieving a downhole pump-and-packer assembly after adding each section of standard length auger (1.7 yards) during drilling are difficult and time-consuming.
A new tool developed by the U.S. Geological Survey (USGS), called Enhanced Screen Auger Sampling System (ESASS1), generally alleviates these disadvantages of using a screen auger to vertically profile and sample groundwater quality. The use of ESASS, because of its unique U.S. pat-ent design (U.S. patent no. 7,631,705 B1), allows for the collection of representative, depth-specific (vertical profil-ing) groundwater samples in a quick and efficient manner during hollow-stem auger drilling.
ESASS can provide benefits to the groundwater com-munity as you need to know vertical trends in groundwater quality and distribution of contaminant plumes. The primary benefits include:
• collection of representa-tive and time-efficient groundwater samples during vertical profiling
• the ability to vertically profile the subsurface when it is underlain with coarse-grained deposits that resist penetration with some direct-push technology
• under-standing of vertical variation of groundwater chemistry and distribution of contaminants
• improved placement of observation well screens
• groundwater quality samples from ESASS profiles can be compared to samples from similar depths in nearby wells.
For this article, ESASS was utilized at two types of sites, grouped into two broad categories: a waste site with anthropogenic contamination from waste disposal and reference sites with no known waste-disposal history. At each of the sites, water-quality sampling was tailored to specific project needs. At the waste site, ESASS profile results were compared to results from wells installed for this work and from borehole logs to help validate ESASS find-ings. Information from vertical profiling with ESASS was used to map a contaminant plume during remediation opera-tions. At the reference sites, ESASS profile results will be used as a framework to understand variations in ambient, shallow groundwater chemistry for an ongoing study link-ing land use and its effect on shallow groundwater quality for the Boston metropolitan area.
Tool Time
ESASS works with standard, commercially available hollow-stem auger flights. Flights are fabricated of 1020 mild steel material (Thomas 2010). The test version of the ESASS tool also was fabricated of steel; however, it is antic-ipated that subsequent tool revisions will be fabricated of stainless steel or other chemically inert substance.
ESASS utilizes a 1-foot long screened section of a 2-foot long hollow-stem auger, an auger drill rig and the ESASS tool-a unique downhole plug system-to collect groundwater samples at specific subsurface depths. A diagram of the ESASS tool is shown in Figure 1.
ESASS isolates the water column in the auger flights above the screen auger (generally the lead auger) from the water in the screen auger by a specially designed remov-able plug and collar that fits inside a standard-diameter auger (3.25 inches inner diameter). The plug is retrievable down through the center of the auger flights using conventional drilling A-rods because of a unique relation between the plug, collar and A-rod.
ESASS was designed to meet the following criteria:
• water inside the screen auger is isolated from the water column above, preventing leakage
• the sample tubing extends from the screen auger up to the land surface
• the removable plug allows a well having a 2 inches inside diameter (2.37 inches outside diameter) to be installed inside hollow-stem augers
• sample tubing is contained within the augers in a manner that does not interfere with drilling or with installing the well
• tubing is easily connected and disconnected as auger flights are added or removed, and (6) the ESASS system minimizes cross con-tamination during water-quality profiling.
Multiple ports are constructed in the plug, and tubing is run from the screen auger, through the watertight con-nections of the ports in the plug, up the column of auger flights and then to the surface. In this way, the tubing is a direct conduit to the water in the screen auger. A down-hole (0.85 inches outer diameter) slim line (less than 1.003 inches diameter) stainless steel bladder (Geotech 1 .85 model) pump is attached to the lower ESASS plug assembly and placed inside the screen auger. The air and discharge lines of the bladder pump are attached to the ports below the top plug. Above the top plug, these same ports have tubes that extend to the surface within the auger flights. In addition, a separate port and tube connect with a peristaltic pump to allow water to be extracted or injected.
Tubing for the airline and for the additional extraction/ injection line consists of polyethylene material and has an outer diameter of 0.25 inches and an inner diameter of 0.17 inches. Tubing for the water extraction line from the bladder can consist of either polyethylene or tef-lon material, depending on project sampling protocols, and it has the same outer and inner diameters. Tubes are extended within the auger flight in 20-foot sections. Tube connections are made using brass compression unions, 0.25 inches in diameter, and plastic delrin sleeves, also 0.25 inches in diameter, hold the tubing in place.
Assembly of the ESASS tool with an attached bladder pump and associated tubes is relatively easy and typically takes less than an hour. Adding each additional tubing sec-tion also is easy and takes five to 10 minutes per section (usually four auger lengths per section).
To sample at any depth interval, the user stops auger drilling, disconnects the auger bell that connects the auger flights to the drill rig, pulls the tubes out from within the auger flight, and connects the appropriate tubes to their associated lines. Tubes are distinguished from one another by adding color-coded tape at each juncture, thus insuring correct connections. Sampling time varies and is a function of the permeability of the formation and the amount of fine-grained sediments encountered. Users can expect to add approximately 20 minutes of purge time per sample.
Trial and error with ESASS in resistant subsurface lay-ers of cobbles and boulders has shown that the design of the screen auger as well as the configuration and placement of ESASS are critical for insuring the structural integrity of both. A 10-slot opening (0.010 inch) laser-cut screen auger, with 119 vertical slots per foot (0.305 m) of auger was used initially as the lead-screen auger. However, the auger was damaged when it encountered a resistant layer with cobbles and boulders. Other slot sizes were tested, ranging from 0.025 inches to 0.25 inches, which proved more effective in penetrating resistant layers. All auger screen-slot openings tested had a total intake area of approximately 1.50 square inches, which allowed a maximum entrance volumetric rate of water up to 2 quarts/minute through the slots, given entrance velocities and their associated constraints (Johnson 1966).
To provide additional protection of the ESASS tool at locations with underlying resistant layers, users can house the ESASS in a separate auger above the first lead-screen auger. The separation of the lead-screen auger from the auger containing ESASS provides additional strength that protects the ESASS if the lead-screen auger is damaged during drilling. This configuration places the intake of the bladder pump, if equal length 0.61-m long augers are used, approximately 0.2 yards above the top of the uppermost slot in the lead-screen auger and 0.5 yards above the bottom slot, a distance of 0.3 yards from the midpoint. At sites lacking resistant subsurface layers, ESASS can be placed inside the lead-screen auger, thereby reducing the volume amount of water needed to evacuate stagnant water below the ESASS plug assembly prior to sample collection.
ESASS can be used with an inner sleeve to reduce tur-bidity in fine-grained formations. The inner sleeve consists of a 2.5-inch inner diameter, 2.75-inch outer diameter, 0.010-inch slot, PVC schedule 40 and screen pipe. The use of an inner sleeve allows for flexibility in the size of the openings-also known as slots-used in the screen auger. An optional filter pack also can be used to fill in between the PVC screen sleeve and the inner diameter of the auger. The filter pack is coarse sand, rinsed with deion-ized (D.I.) water. Depending on whether the filter pack is used, approximately 3.2 quarts of water for one auger 0.7 yards in length or 6.3 quarts of water for two augers totaling 1.3 yards in length are contained below the plug assembly.
Sampling Using ESASS
Before sampling, water is purged from below the top plug of the ESASS until a minimum of one volume of water equivalent to that occupying the volume below the ESASS top plug is evacuated. This minimum volume equals 3 to 6.3 quarts, depending on whether an auger in addition to the screen auger is used to house the ESASS. During purging, sample turbid-ity is visually monitored while measuring field parameters (water temperature, water electrical conductivity [specific conductance], dissolved oxygen, and pH). Typically, field parameters stabilize after several quarts of water are evacu-ated. The peristaltic pump can be used to purge water from the screen auger when water depths are less than 6.7 yards. A maximum purge rate of 0.4 quarts/minute is achievable with the peristaltic pump. The purge rate of the bladder pump tested for this study was approximately 0.3 quarts/minute.
If the peristaltic is used to purge water from the screen auger, the bladder pump is purged an additional minimum amount of 0.2 quarts for tube lengths less than 40 feet. That additional minimum volume equals the vol-ume of water in one 40-foot length of tube and the volume within the bladder chamber (0.04 quarts). For tube lengths greater than 13.3 yards, the amount of sample water purged with the bladder pump increases by 0.1 quarts for each additional 6.7-yard length of tube. After the minimum volume requirements are met during bladder pump purging, field parameters are again measured and compared to field mea-surements taken after using the peristaltic pump (if used). Once the field parameters have stabilized to within 0.2 units for pH, and to within 5 percent for conductivity, sample collection begins.
After vertical profiling is completed, an observation well can be installed in the same profile hole at a selected depth based on project guidelines. If real-time analysis is available, then the observation well screen can be set on the basis of the chemical results. To install the well, the auger screen is positioned at the depth where the bottom of the well will be set. After the ESASS plug is removed by using the A-rods, the well is then set and installed through the augers and through the ESASS collar into the profile hole following conventional hollow-stem auger methods (Shuter and Teasdale 1989). The inner sleeve screen pipe used for protecting the pump from fine-grained sediments is sacri-ficed during installation of the well.
Study Approach
To test ESASS, we collected profile samples at one waste site in October 2007. ESASS profile results were compared to samples from wells installed immediately after profiling, and other adjacent, previously installed wells. Groundwater quality from the ESASS profile was analyzed in conjunc-tion with borehole geophysical logs that were collected in the installed wells. We also collected profile samples at two reference sites in August 2008 and observation wells were installed after completion of the vertical profiles. Samples from the observation wells were unavailable immediately after installation but were taken in June 2010 as part of a routine sampling program by the USGS National Water-Quality Assessment (NAWQA) Program to investigate shallow groundwater quality and impacts from land use for the Boston metropolitan area (Flanagan et al. 2000).
The locations of the field sites are shown in Figure 4. The waste site was in a river valley whereas the two refer-ence sites were in a marine coastal setting. Unconsolidated, stratified-drift deposits of glacial outwash and glaciomarine origins underlie all three sites.
The site is a former industrial facility in Milford, N.H., that has been identified as the primary source area leading to contamination of a nearby municipal well, called the Savage Municipal Well. The site was listed as a Superfund Site in 1984 and named after the aforementioned well. Previous disposal practices of tetrachloroethylene (PCE) at the site caused the formation of a large contaminant plume. ESASS was used to help map the vertical distribution of the plume during the installation of observation wells up to 27.3 yards deep in 2007. Subsequent sampling (low flow and passive-diffusion bag [pdb] samples) for groundwater quality were collected from these wells in October and November 2007 and compared to the water quality results obtained in October 2007 from the ESASS profile.
The site contains a remedial system consisting of a low-permeability barrier that encircles the highest-detected concentrations of PCE, and a series of injection and extrac-tion (pump and treat) wells both inside and outside the barrier. The barrier sits primarily atop the underlying till and bedrock. To accelerate remediation efforts inside the barrier, in situ chemical oxidation (ISCO) treatments were initiated on several occasions from 2003 to 2008. ESASS was tested at several vertical profile locations in 2007 through 2008 to assist in mapping of PCE concen-trations and to help gauge the success of remediation inside the barrier. Results from one vertical profile (VP7002) from 2007 are presented in this article.
Constituents sampled during ESASS profiling included:
• field parameters: dissolved oxygen, water temperature, water electrical conductivity, and pH
• total organic car-bon
• volatile organic compound (VOC) headspace analysis for selected compounds.
Field parameters were mea-sured on site with portable field meters. Total organic carbon was collected and submitted to the New Hampshire Department of Environmental Services (NHDES) for analysis with U.S. Environmental Protection Agency (U.S. EPA) analytical method SM5310B. VOC samples were collected in 40-ml vials and submitted to the U.S. EPA Chelmsford Laboratory for analysis of selected compounds using headspace protocol (Clifford 2008).
ESASS results for water electrical conductivity and for PCE were compared to samples from wells installed after profiling in the same profile hole and from preexisting adja-cent wells at the site. Specific conductance in wells was measured in situ with a downhole probe along the screen interval and compared to measurements from the corre-sponding ESASS profile. Water electrical conductivity from the ESASS profile also was compared to a borehole electro-magnetic (EM) conductivity log that was collected within the installed well by methods described by Williams et al. (1993). EM logs measure the bulk electrical conductivity of the aquifer outside the well and can be used to profile along cased and uncased sections of the well. EM conductivity was converted to equivalent pore water conductivity by uti-lizing an Archie Law relation (Archie 1942). Wells were sampled for VOCs following low-flow protocol (a low-flow rate to minimize mixing of the water column in the well) and using pdb sampling techniques (Harte et al. 2000). PCE concentrations from the ESASS profile were compared to PCE concentrations from wells installed within the same ESASS profile hole and other nearby locations. The vertical variations in PCE concentrations from the ESASS profile were also compared to a profile from a borehole natural gamma log that was used to map variations in subsurface geology. The natural gamma log responds to changes in lithology and mineralogy of the subsurface geology; and low gamma counts can be used to identify clean, well-sorted permeable layers (Keys 1990).
The two reference sites were located in a coastal setting of Massachusetts and include a wooded, rural-subur-ban developed area in East Bridgewater, and a residen-tial, suburban developed area in Duxbury. The sites were selected for ESASS profiling as part of a USGS NAWQA study (Flanagan et al. 2000). ESASS was used to help identify vertical distribution of ground-water quality during the installation of shallow, short-screened (less than 8 meters in depth and 0.7 yards in length) observa-tion wells. Observation wells were sampled in June 2010 as part of a routine sampling program by the USGS NAWQA study. Therefore, given the time disparity, a rigorous comparison of water-quality results from the ESASS profile and obser-vation wells is problematic.
ESASS profile water samples were collected for field measurements (dissolved oxygen, water temperature, water electrical conductivity, and pH), and constituents analyzed for nutrients, major ions, and VOCs (mass spectrometer) from water samples collected, processed and then shipped to the USGS National Water-Quality Laboratory (NWQL). Filtered samples for nutrients, major ions, and trace-ele-ments were analyzed using inductively coupled plasma mass spectrometry (ICP/MS). Unfiltered samples for VOCs were analyzed according to methods described by Rose and Schroeder (1995) and Conner et al. (1998). Additionally, three water samples were collected, processed and shipped to the USGS Laboratory in Reston, Va., for age dating based on the presence of chlorofluorocarbons (CFCs). CFCs are a ubiquitous environmental tracer that can be used to provide an apparent age of groundwater based on assump-tions concerning recharge, transport and reactions of CFCs in groundwater. Samples for age dating of groundwater were analyzed according to methods described by Busenberg and Plummer (1991) and by Plummer and Busenberg (1999). ND
This article was reprinted with permission from the Winter 2011 issue of Ground Water Monitoring & Remediation, a publication of the National Ground Water Association. Look for the results of the ESASS study in Part 2 of this article in the January 2013 issue of National Driller.
References
Archie, G.E. 1942. The electrical resistivity log as an aid in deter-mining some reservoir characteristics. Petroleum Transactions of AIME 146: 54–62.
Busenberg, E., and L.N. Plummer. 1991. Chlorofluorocarbons (CCl3F and CCl2F2)-Use as an age dating tool and hydro-logic tracer in shallow ground water systems. In Proceedings, U.S. Geological Survey Toxic Substances Hydrology Program, Technical Meeting.
Monterey, California, March 11–15, 1991, ed. G.L. Mallard and D.A. Aronson. U.S. Geological Survey Water-Resources Investigations Report 91-4034, 542–547.
Clifford, S. 2008. Writen commun. to author. U.S. Environmental Protection Agency, Region 1.
Flanagan, S.M., D.L. Montgomery, and J.D. Ayotte. 2000. Shallow ground-water quality in the Boston, Massachusetts metropolitan area. U.S. Geological Survey Water-Resources Investigations Report 01-4042, 12. http://pubs.water.usgs.gov/wrir01-4042 (accessed April 2009).
Harte, P.T. 2008. Differential rates of PCE declines in a sand and gravel aquifer, in National Ground water Association 2008 Ground Water Summit, Memphis, Tennessee.
Harte, P.T., M.J. Brayton, and W. Ives. 2000. Use of passive dif-fusion samplers for monitoring volatile organic compounds in ground water. U.S. Geological Survey Fact Sheet 088-01, 4.
Johnson, U.O.P. 1966. Groundwater and Wells, 1st ed. St. Paul, Minnesota: Edward F. Johnson, Inc.
Keys, S.W. 1990. Borehole, geophysics applied to ground-water investigations. U.S. Geological Survey, Techniques of Water-Resources Investigations, Book 2, chap. E2, 150.
Pitkin, S.E., J.A. Cherry, R.A. Ingleton, and M. Broholm. 1999. Field demonstrations using the Waterloo Groundwater Profiler. Ground Water Monitoring and Remediation 19: 122–131.
Plummer, L.N., and E. Busenberg. 1999. Chlorofluorocarbons: Tools for dating and tracing young ground water. In Environmental Tracers in Subsurface Hydrology, Chapter 15, ed. P. Cook and A. Herczeg, 441–478. Boston, Massachusetts: Kluwer Academic Publishers.
Rose, D.L., and M.P. Schroeder. 1995. Methods of analysis by the U.S. Geological Survey National Water Quality Laboratory- Determination of volatile organic compounds in water by purge and trap capillary gas chromatography/mass spectrometry. U.S. Geological Survey Open-File Report 94-708, 26.
Shuter, E, and W.E. Teasdale. 1989. Application of drilling, cor-ing and sampling to test holes and wells. Techniques of Water Resources Investigations of the U.S. Geological Survey, Book 2, Chap. F1, 97.
Taylor, T.W., and M.S. Serafini. 1988. Screened auger sampling: The technique and two case studies. Ground Water Monitoring and Remediation 10, no. 4: 145–152.
Thomas, D. 2010. Written communication to author. Central Mine Equipment Company. November 22, 2010.
Williams, J.H., W.W. Lapham, and T.H. Barringer. 1993. Application of electromagnetic logging to contamination inves-tigations in glacial sand-and-gravel aquifers. Ground water Monitoring and Remediation Review 13, no. 3: 129–138.

Report Abusive Comment